Sediment survey results
Baseline sediment survey
The results are in!
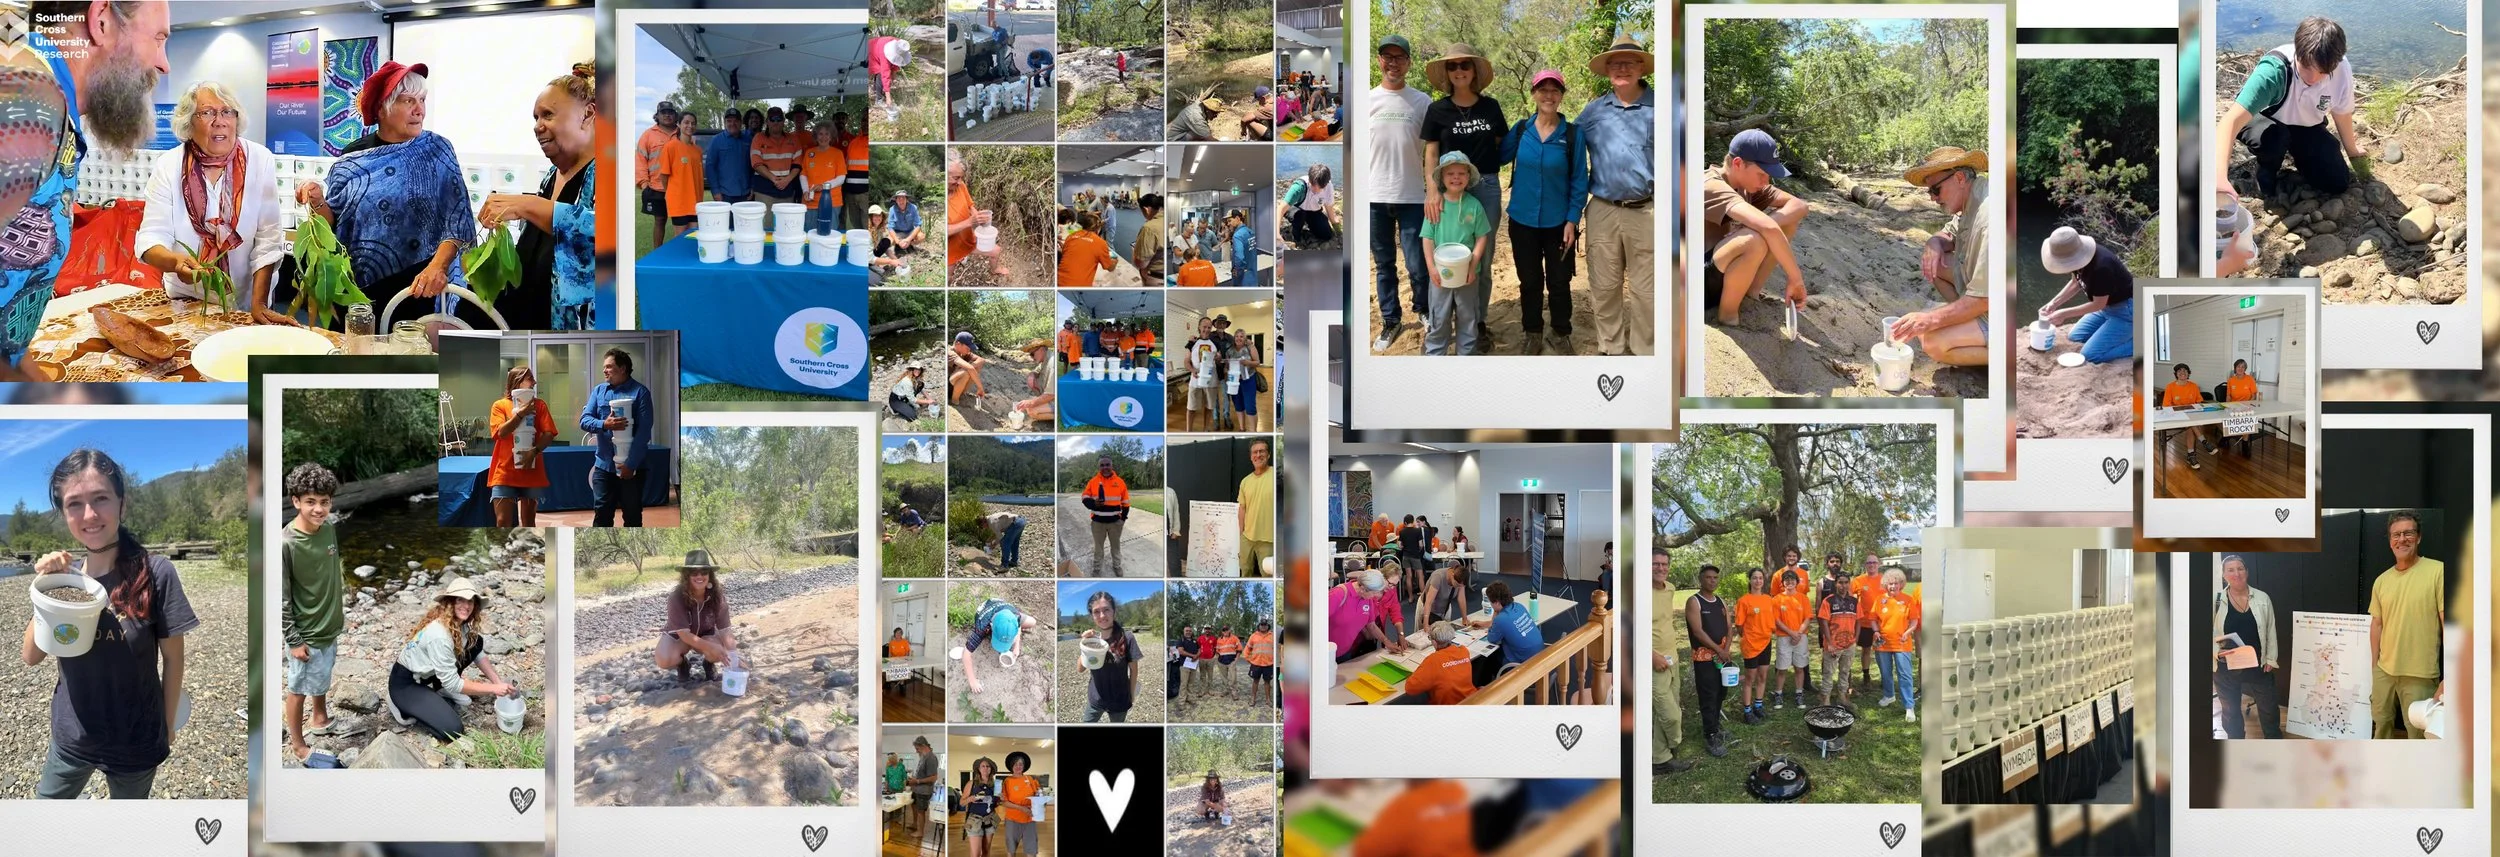
In October 2025, our community came together to take the pulse of the Clarence — a beautiful example of looking after Country and the river we all love.
200+ community volunteers
120+ sediment samples
Collected from right across the catchment
The samples have completed their science journey at Southern Cross University and we're pleased to share the results with you.
What did we find?
River sediments hold a long memory of the catchment around them. This survey builds a catchment-wide baseline of what's in the Clarence's sediments now, so we can measure any future change against it.
The key things to know:
The metals and elements we tested for are natural. Arsenic, chromium, copper, zinc and all the rest occur naturally in the catchment's rocks, soils and sediments — finding them is expected.
What matters is how much. Results are compared against national sediment guidelines that flag when river life might be affected.
The great majority of sites sit comfortably within the natural background range.
Where levels are higher, there's usually a natural explanation — the local geology, or the legacy of historic mining in parts of the catchment.
Only a handful of sites rise above the higher guideline level. Each has a sensible explanation — a nearby former mining area, or simply the local rock type — and all are clearly flagged on the map.
That's exactly what a baseline is for: a clear snapshot of our river as it is now, so we — and those who come after us — can keep watch over it for years to come.
How do our results compare with the guideline values?
The vast majority fall comfortably within the guidelines for every metal tested
The adjacent table shows, for each metal with a national guideline, how many sites were elevated or of high concern
Every sample not counted in those two columns sat in the safe range
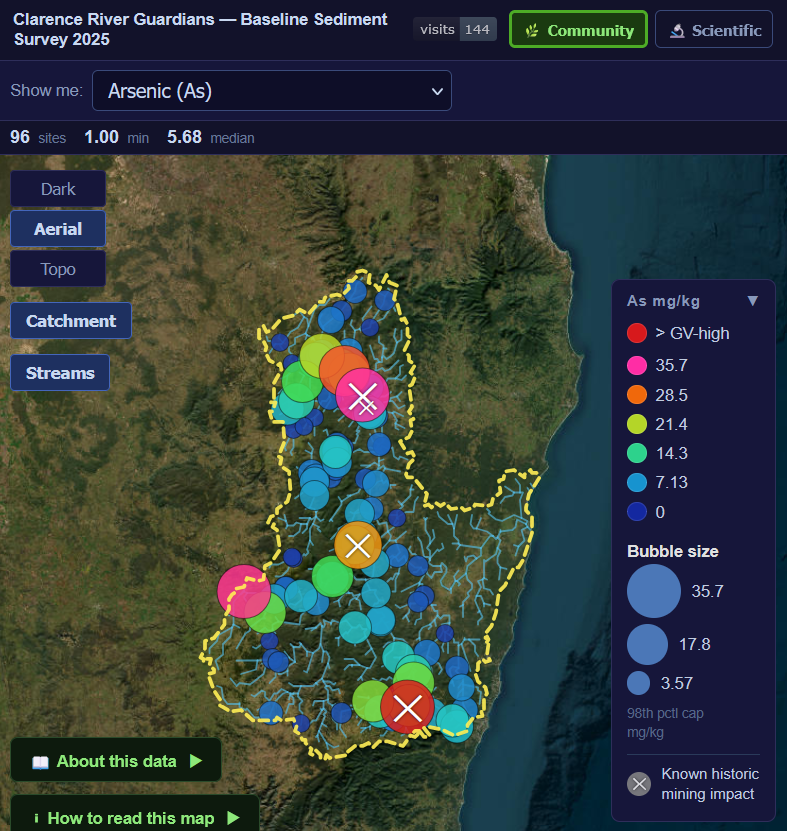
Click on the map to visit the interactive dashboard and explore.
Explore the results
Every site sampled is on the interactive map.
Click the above dashboard image to open it, then explore your own stretch of the river.
Bubbles show locations of sediment samples
Bigger and brighter = higher concentration of the selected element.
Red marks sites above the high-concern guideline (GV-high), where one exists.
Sites marked X are near known historic mining activity.
Hover over any bubble to see the value and how it compares to guideline values (where available - Note: not all metals have guideline values).
Table of guideline value exceedance
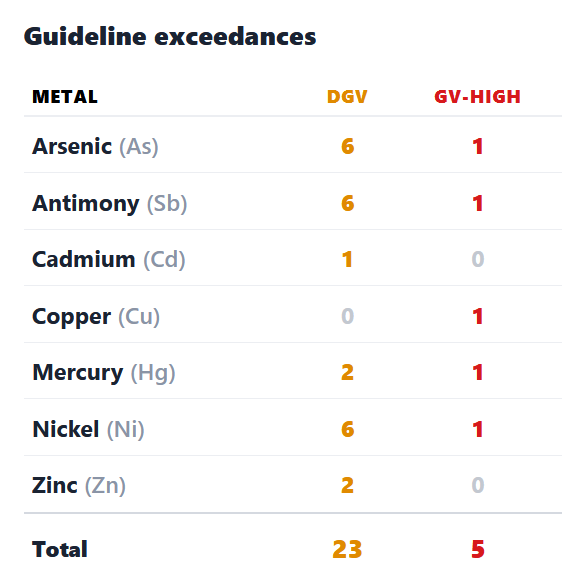
How to read this table:
DGV = the low-risk line (amber). Below it, harm to river life is very unlikely — where the great majority of sites sit. 23 sites sit above the low-risk line — worth noting, not alarming.
GV-high = the higher-concern line (red). Above it, effects are more likely and a site is worth a closer look.
5 results sit above GV-high — these show up red on the map. Four of these are associated with past mining, one reflects naturally metal-rich local rock.
Units: milligrams per kilogram of dry sediment (mg/kg), from the national ANZECC/ARMCANZ (2000) sediment guidelines.
Only 9 metals have national sediment guidelines — so only these can be scored.